If you ever wonder how databases are organized or how data in a system is connected, entity relationship diagrams are the answer. These diagrams help us see the data clearly and simply, like a map for a database.
Besides, they are useful for everyone, whether you’re new to databases or have been working with them for a while. In this article, we’ll look at what they are, how they work, how you can create them, and see how they can help us organize and understand data better.
Understanding the ER diagrams
1. What is entity relationship diagram?
An Entity Relationship Diagram (or ERD in short) is a specialized graphic that illustrates the interrelationships between entities in a database. Entities, in this context, are objects, people, places, events, or concepts about which data is stored.
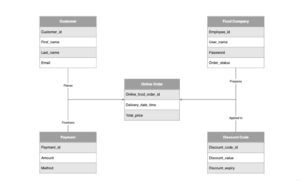
ERDs use standardized symbols to represent these entities, their properties (attributes), and their relationships. This visual representation simplifies complex database structures, making them more accessible and understandable.
2. The purpose of entity relationship diagrams and their uses
The primary purpose of ERDs is to provide a clear and structured visual representation of data and its interrelations within a database. This clarity is crucial during the database design phase, where understanding how different entities relate to each other is essential for creating an efficient and effective database structure.
ERDs are widely used in various stages of database development, including:
- Requirement Analysis: ERDs help you to understand and analyze the data requirements of an organization or a project.
- Database Design: They are instrumental in designing the database architecture, outlining how tables (or collections in non-relational databases) are related.
- Documentation: ERDs serve as valuable documentation tools, providing a clear reference for developers and stakeholders and aiding in future database modifications or troubleshooting.
- Education: In academic settings, we also use ERDs to teach database design, helping students visualize how databases work and how different data elements interconnect.
Components of entity relationship diagrams
Entity relationship diagrams include several key elements, each serving a specific purpose in representing the database’s structure. Therefore, it is compulsory to understand these components for creating and interpreting ERDs.
1. Entities – The building blocks
Entities are the foundational building blocks in ERDs, representing tangible or conceptual objects that hold data. Visualized as rectangles in ERDs, these entities are akin to nouns in a language, denoting items like “Customer,” “Order,” or “Product” in a business database.

Additionally, entities are bifurcated into two categories. One is Strong entities, which exist independently and possess a unique identifier. The other is Weak entities, which rely on a strong entity for their existence and are identified through a partial key.

This distinction is crucial as it shapes how entities are interconnected and function within the database’s ecosystem.
2. Relationships – Connecting the dots
One of the most vital aspects of entity relationship diagrams is the portrayal of relationships, the connective tissue that links entities. Illustrated as lines weaving between entities, these relationships delineate how data in one entity relates to data in another.
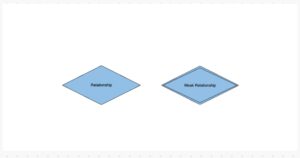
The nature of these relationships varies, encompassing one-to-one, one-to-many, and many-to-many types. Each type offers a unique lens through which the interactions between data points are viewed, reflecting the complex dynamics of real-world data interactions.
3. Attributes – Describing the entities
In ERDs, attributes play the role of defining the characteristics of entities, represented as ovals connected to their respective entities. They provide the specifics, the adjectives, that describe the nature of the data held within an entity, such as a student’s name or a product’s price.
Additionally, attributes can be simple, comprising a single piece of information, or composite, consisting of multiple related data points. They can also be single-valued, holding one piece of data, or multi-valued, capable of containing several data entries.
The distinction of key attributes, often underlined, is critical as they uniquely identify an entity within the database, ensuring data integrity and uniqueness.
4. Primary and Foreign Keys – Ensuring uniqueness and connectivity
Within the landscape of ERDs, primary keys and foreign keys emerge as critical elements. Primary keys serve as the unique identifiers for each entity instance, much like a unique fingerprint for each record in a database.
On the other hand, foreign keys act as bridges, linking attributes in one entity to the primary keys in another, thus forging meaningful connections between disparate data points.
More importantly, these keys are not just mere attributes. They are the pillars that uphold the relational integrity and coherence of the database structure.
5. Advanced components to enhance entity relationship diagrams
Beyond the basics, ERDs are often augmented with advanced components like cardinality and modality, which bring precision to the depiction of relationships.
Cardinality quantifies the relationships, specifying the numerical bounds between entity instances. Meanwhile, modality indicates the obligatory nature of these relationships.
Furthermore, derived attributes, calculated from other data points, and participation constraints, which set the rules for entity interrelations, add layers of depth and clarity, enriching the ERD’s narrative.
Types of entity relationship diagrams
Here are some common types of ERDs you may come across when operating or working in your business.
1. Conceptual ERDs
These provide a broad overview of the system, focusing on high-level entities and their relationships.
2. Logical entity relationship diagrams
They dive deeper, presenting detailed relationships, entity types, and key attributes, crucial for database design.
3. Physical ERDs
Physical ERDs depict the implementation specifics in the database, including table structures, constraints, and column names.
4. Comparative analysis
Understanding the distinct roles of each ERD type is key to effectively applying them to different stages of database development.
How to create an entity relationship diagram, a BASIC one
The process for drawing ERDs can be straightforward and manageable, even for those new to the concept. By following these simple steps, you can create a basic entity relationship diagram.
- Identify entities and relationships
You can start by mapping out the system’s key components and their interactions, an essential step in laying out the ERD’s foundation.
- Define attributes
Then, you should carefully determine the attributes for each entity, ensuring comprehensive data representation.
- Establish keys
Once you have finished defining attributes, you can assign primary and foreign keys to establish and link entities uniquely and accurately.
- Draw conventions
Last but not least, you should stick to standard ERD symbols and notations for clarity and consistency.
Wanting a tool to draw entity relationship diagrams for Confluence and diagrams for Jira? Try Mocky now!
Limitations of entity relationship diagrams
Entity relationship diagrams are powerful tools for modeling and understanding the structure of a database but with certain limitations. Therefore, you must recognize some of them to avoid falling into the pitfall.
1. Complexity in large databases
ERDs can become unwieldy and difficult to interpret for huge and complex databases. As the number of entities and relationships increases, the diagram can become cluttered and challenging to navigate, reducing its effectiveness as a communication tool.
2. Static representation
ERDs provide a static view of the database structure. They do not capture dynamic aspects such as data processing, data flow, or real-time changes in the database. This static nature means they might not fully represent the operational aspects of a system.
3. Limited scope
ERDs focus primarily on entities and relationships. They might not adequately represent other aspects of the database system like user interfaces, software behavior, or performance considerations.
4. Ambiguity and interpretation
ERDs are subject to interpretation. Different designers might interpret the requirements and relationships between entities differently, leading to variations in the design.
Therefore, this can be a challenge in ensuring consistency and common understanding across different team members.
5. Focus on structure, not function
While ERDs are excellent for outlining the database structure, they do not provide information about the functionality or the business logic of the system. Additional documentation and diagrams are often necessary to capture these aspects.
Final thoughts
Now that we’ve gone through the basics of entity relationship diagrams, you should find this helpful tool less complicated.
These diagrams are great for showing how data is connected in a database, making our work with databases much easier. Moreover, the key points we have covered will help you start using ERDs in your projects, giving you a clearer view of your data.
Remember, ERDs are like maps that guide us through complex data, helping us make better decisions and communicate our ideas more clearly. Therefore, you can keep using ERDs while working with databases, and you’ll find them becoming an essential part of your data management skills.