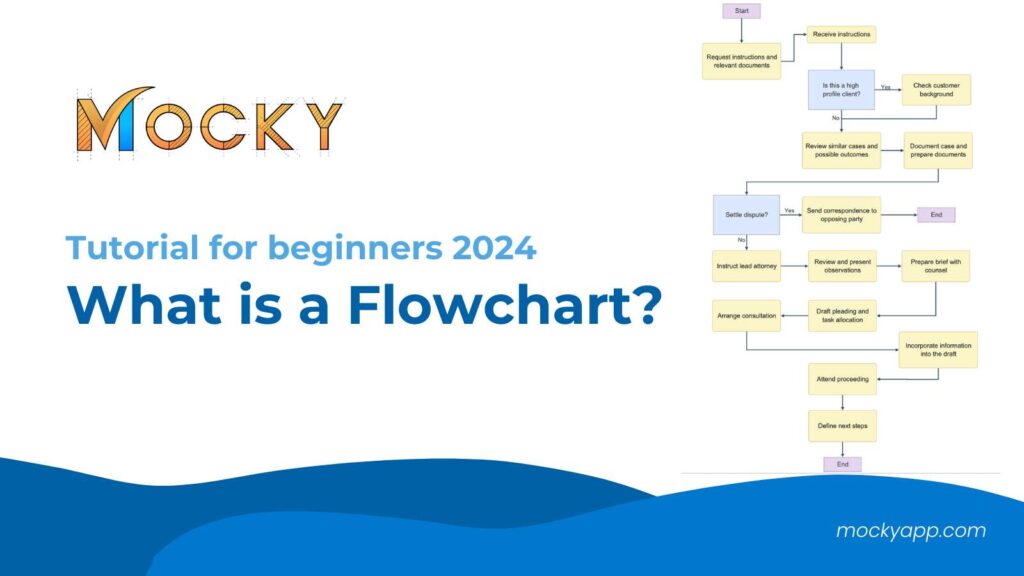
What is a Flowchart? Flowcharts are powerful tools used across various fields for planning, documenting, and managing complex processes visually and intuitively. This guide is specifically tailored for beginners, offering you an introduction to flowcharts and how they can be utilized effectively. By the end of this tutorial, you will not only understand the fundamental components and types of flowcharts but also learn how to create your flowchart diagrams on Confluence.
So, if you’re ready to dive into the world of flowcharts, let’s get started on this visual journey that promises to enhance your analytical and organizational skills.
What is a flowchart definition?
A flowchart is a diagram that represents a process, system, or computer algorithm. It is commonly used to illustrate the sequence of steps and the relationships between them, making it easier to understand complex processes and workflows. Flowcharts are visual aids that can help streamline project planning, improve understanding, and enhance communication between team members.
Flowcharts employ a variety of symbols to indicate different types of steps – rectangles for tasks or operations, ovals for start and end points, and diamonds for decision points, among others. These symbols are interconnected with arrows that guide the viewer through the flow and sequence of the process.
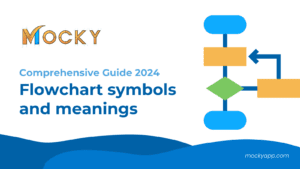
Discover related blog: Flowchart symbols and meanings | Comprehensive Guide 2024
Flowcharts come in several forms, each known by different names based on their specific use. Some of these include Process Flowcharts, Process Maps, Functional Flowcharts, Business Process Mapping, Business Process Modeling and Notation (BPMN), and Process Flow Diagrams (PFD). These diagrams are part of a broader family that also includes Data Flow Diagrams (DFDs) and Unified Modeling Language (UML) Activity Diagrams. Each type is selected according to the particular requirements of the project or process it aims to document, providing a tailored tool for effective process management and visualization.
What is the purpose of the flowchart diagram?
Flowcharts serve a multifaceted purpose in both organizational and educational settings, acting as visual tools that clarify complex systems and enhance operational efficiency. Here’s a deeper look into the primary functions of flowchart diagrams:
Visualization of Processes
Flowcharts are instrumental in visualizing the steps in a process, making it easier to understand. By mapping out the sequence of actions and decisions, these diagrams provide a clear overview of what needs to be done, how tasks are interconnected, and where decisions impact the overall flow. This visual representation is particularly helpful in identifying the roles and responsibilities within a process, ensuring that all team members understand their tasks.
Facilitation of Problem-Solving
One of the key benefits of using a flowchart is its ability to help identify bottlenecks, redundancies, or inefficiencies within a process. By laying out the complete process visually, it becomes easier to pinpoint areas that require improvement. This problem-solving capability makes flowcharts an essential tool for continuous process improvement, aiding teams in refining operations to increase efficiency and reduce waste.
Improvement of Communication
Flowcharts enhance communication among team members by providing a common language with which to discuss complex processes. When all stakeholders can see and refer to the same diagram, it minimizes misunderstandings and ensures that everyone is on the same page. This is particularly beneficial in cross-functional teams where members may not be familiar with each other’s work processes.
Standardization of Procedures
Flowcharts are also used to standardize processes across an organization. By documenting the agreed-upon steps in a flowchart, organizations can ensure consistency in how tasks are performed, regardless of shifts in team composition or individual interpretations of the job. This standardization is crucial for maintaining quality control and operational consistency across large teams and multiple project iterations.
How to make a Flowchart in 5 simple steps with Mocky
Step #1: Select the Appropriate Diagram Type
Understanding the purpose of your flowchart is crucial before you begin designing. Different types of diagrams serve various functions, based on your specific objective, choose the diagram that best suits your needs.
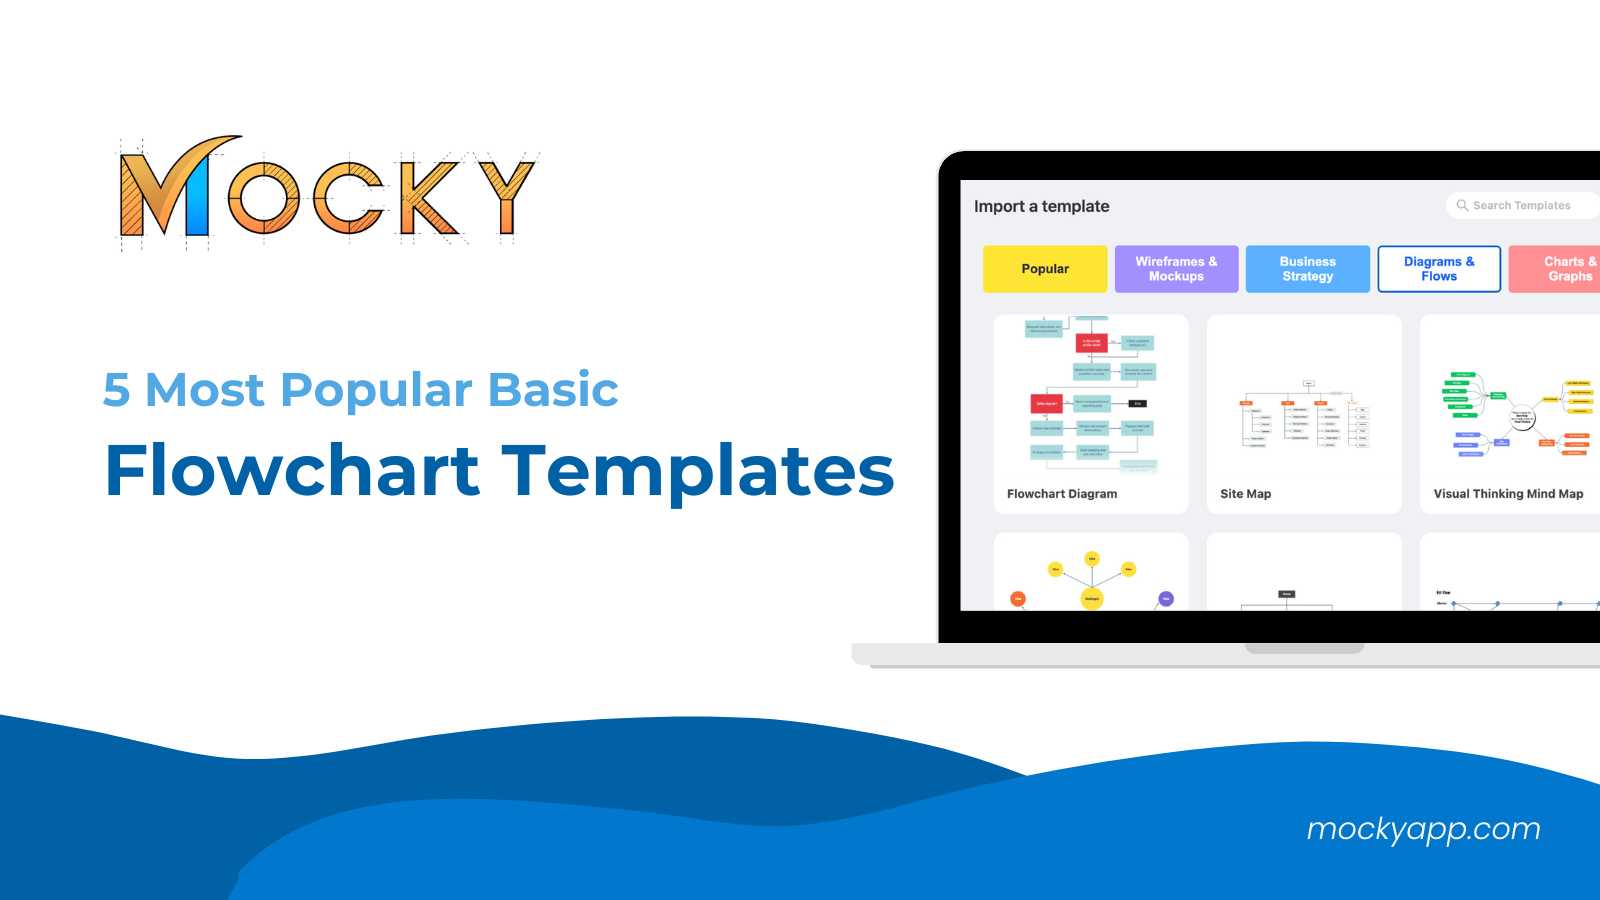
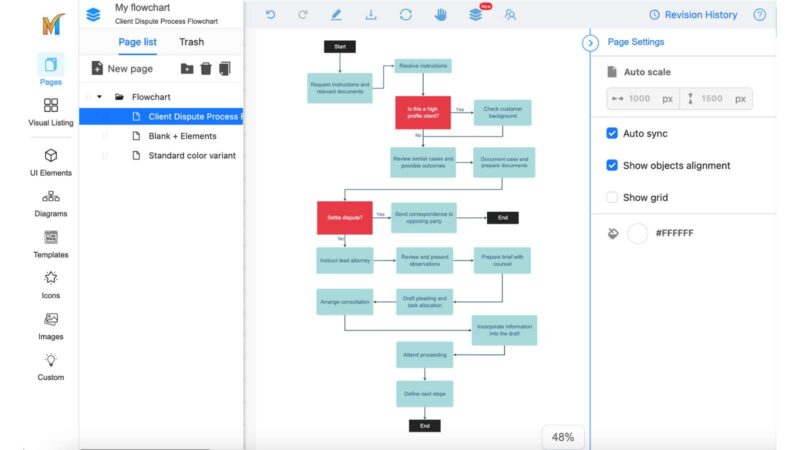
Step #2: Start with a Template
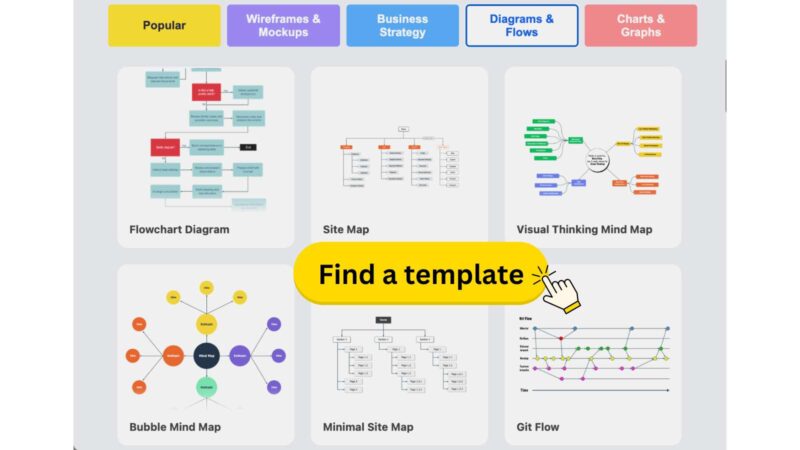
You don’t need to start your diagram from scratch. Utilize the wide array of online flowchart templates available that can be customized to fit your requirements. For those using Jira or Confluence, Mocky offers a rich library of professionally designed templates for various industries. Simply hover over your chosen template and click ‘Save’ to begin customization. Alternatively, you can start with a blank canvas and assemble your diagram using pre-designed content blocks from Mocky.
Step #3: Add Shapes and Symbols
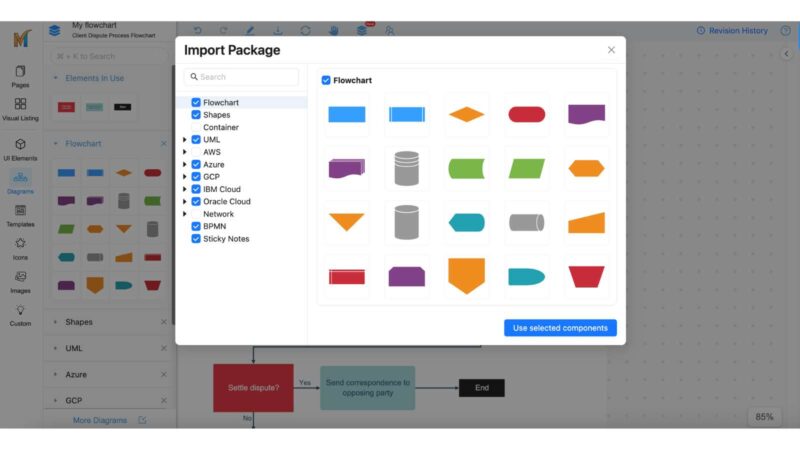
Shapes and symbols are essential components of any diagram, where each symbol represents a different element of the process. Before proceeding, read a brief guide on flowchart symbols to familiarize yourself with the most common shapes. In Mocky, select from a variety of diagram symbols in the interface’s “diagram” section and drag them into your diagram.
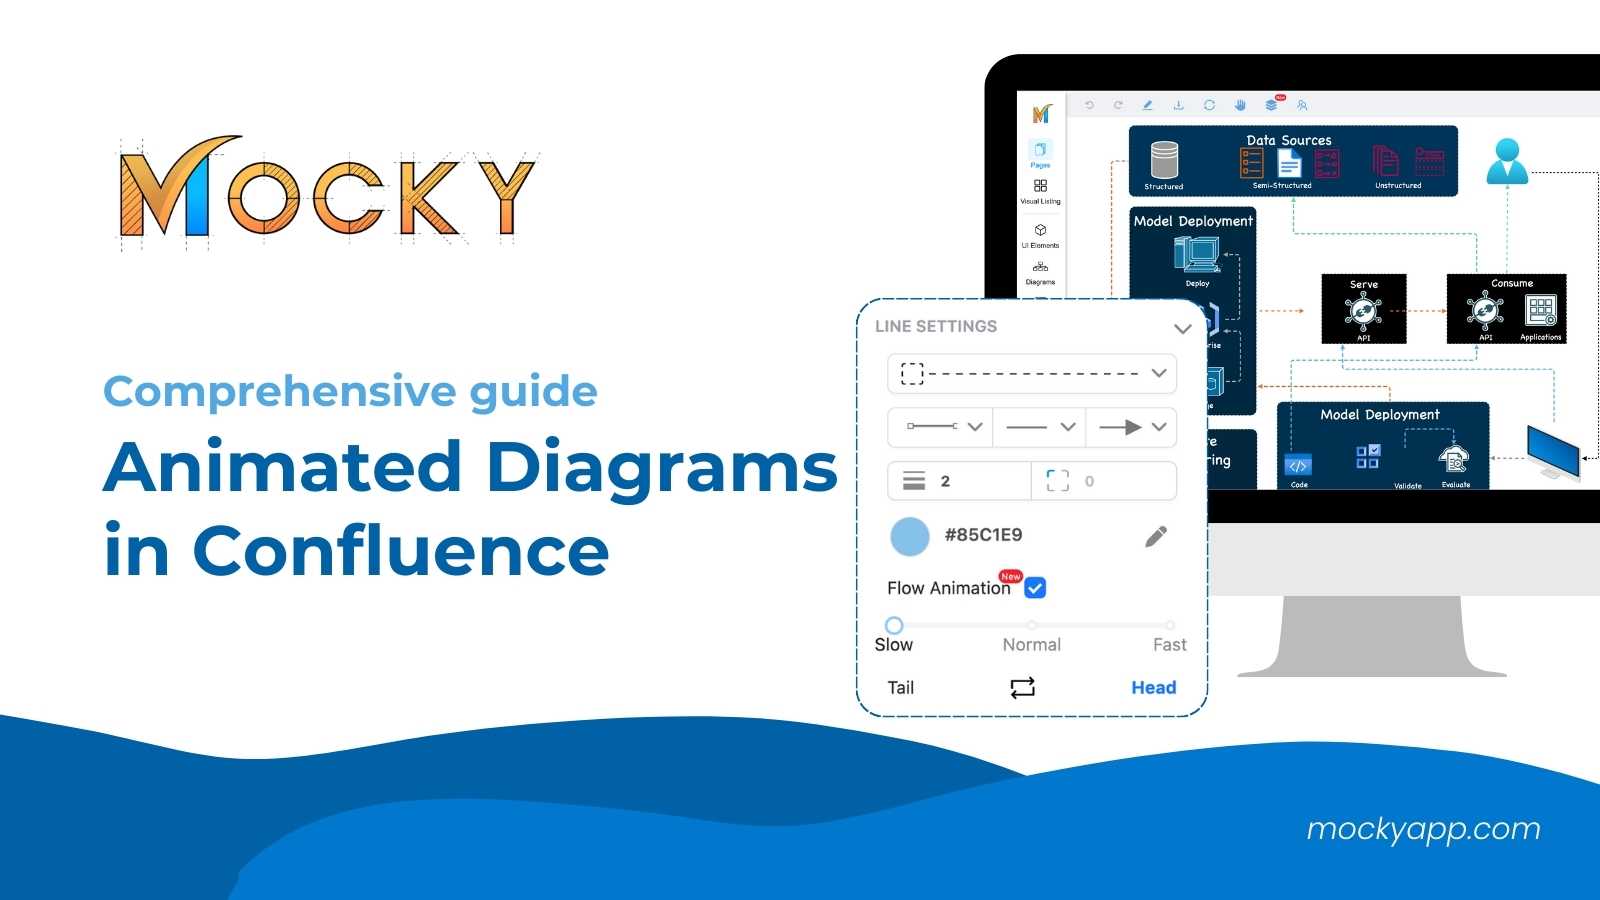
Step #4: Connect Shapes with Lines and Arrows
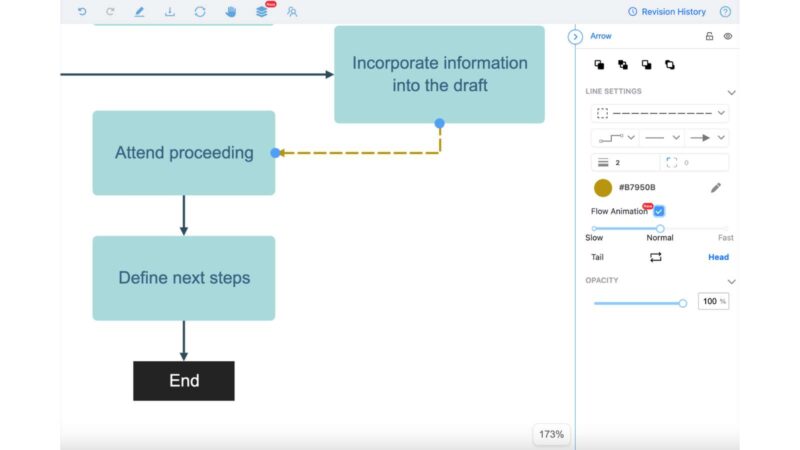
After placing all necessary shapes, connect them with lines and arrows to define the flow of information. Use arrows to indicate specific directions within the flowchart. Mocky provides various line and arrow styles that are easy to customize and arrange. For a dynamic representation, enable flow animation by changing the arrow’s stroke dash and activating the flow animation feature to see your diagram come to life.
See more instructions: How to make Animated Diagrams in Confluence?
Step #5: Save and Share
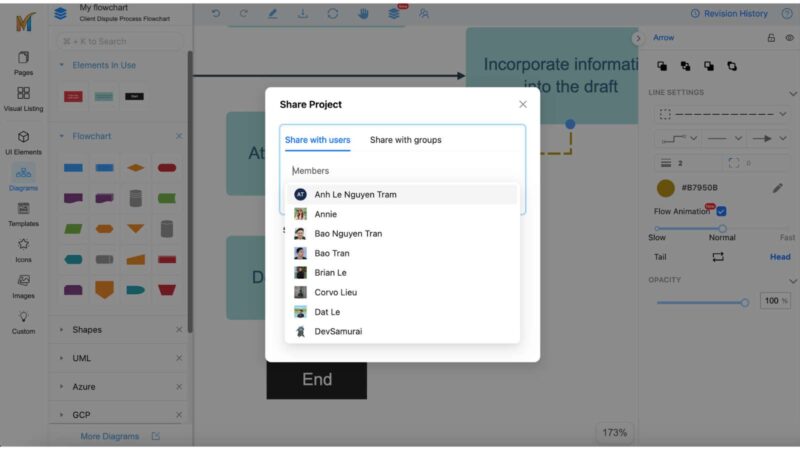
Once your flowchart is complete, review it to ensure the correct use of symbols and overall accuracy. Save your work and share it directly with colleagues through the Mocky app. Mocky also allows you to manage multiple diagrams within the same project, with options to organize them visually using Grid, map, or workflow views.
Final words
With this beginner’s tutorial on flowcharts, we hope that you now have a solid understanding of “What is a flowchart?“. We encourage you to start experimenting with creating your own flowcharts, using the steps and tips provided in this tutorial. Tools like Mocky can simplify the process, making it accessible even for those with little to no prior experience in diagramming.
Get started today and explore more diagram types with Mocky in Confluence!