Flowcharts are a staple in project management and software development, helping teams visualize processes clearly and efficiently. This blog will delve into the various symbols used in flowcharts, explain their meanings, and provide instructions for creating a flowchart.
See more: What is a Flowchart? Tutorial for beginners 2024
Table of Contents
Common Flowchart Symbols
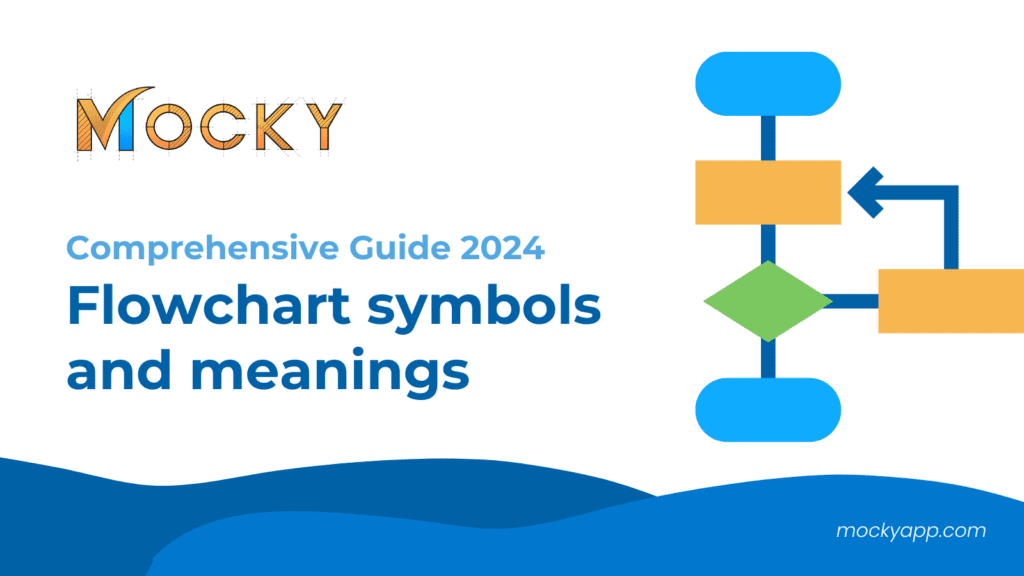
Flowcharts are tools for detailing processes in a visual format. They employ a variety of standardized shapes – or symbols – each representing different stages or actions within a procedure. The use of these symbols in a diagram can vary depending on the process being depicted. Understanding these symbols is crucial for interpreting and creating effective flowcharts. Here’s a guide to the most common flowchart symbols and what they represent:
|
Shapes |
Meaning |
|
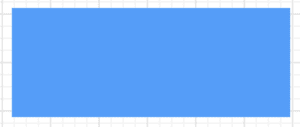
Rectangle (Process) |
It represents a process step where an operation is performed, or a function is carried out within the sequence. | |
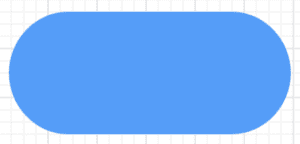
Oval or Pill (Start/End) |
These shapes are used to denote the beginning or end of a flowchart. They help users understand where the process starts and where it concludes. | |

Diamond (Decision) |
This shape indicates a branching in the process, where a yes/no question or decision is made, leading to different paths depending on the outcome | |
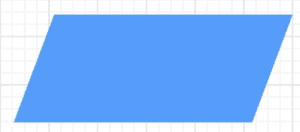
Parallelogram (Input/Output) |
This symbol represents data entering a process or results produced by the process. This shape helps clarify what resources are needed and what will be generated by the process. |
Types of symbols most used in flow diagrams
Data Symbols
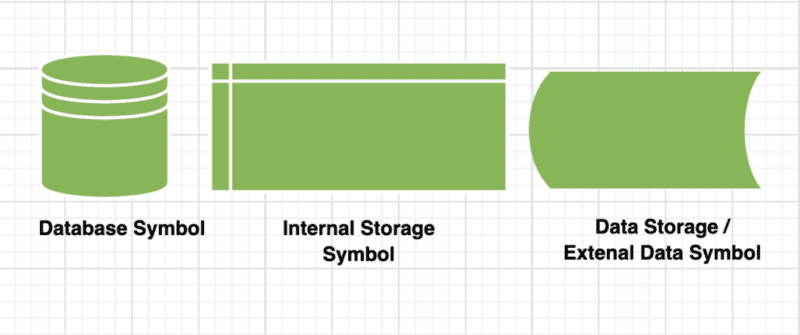
- Database Symbol: Represents a list of information with a standard structure, enabling searching and sorting.
- Data Storage or Stored Data Symbol: Indicates a location where data is saved or stored.
- Internal Storage Symbol: Used in software design to show information stored in memory during a program.
Document Symbols

- Document Symbol: Represents a single printed document or report.
- Multiple Documents Symbol: Indicates several documents involved in the process.
Input and Output Symbols
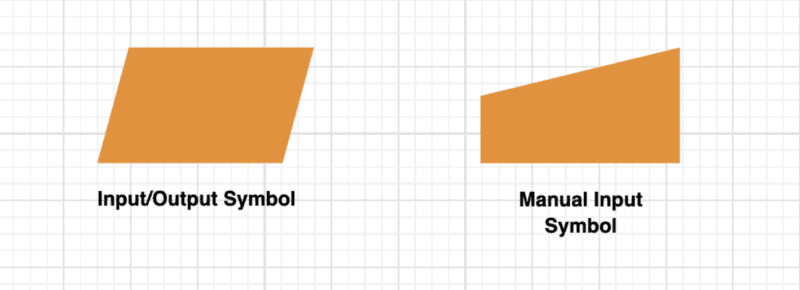
- Input/Output Symbol: Denotes material or information entering or exiting the system, such as customer orders (input) or products (output).
- Manual Input Symbol: This shows where a user must enter information manually.
Union and Connection Symbols
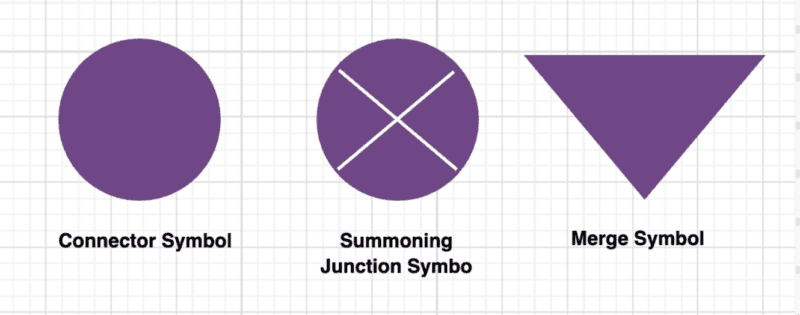
- Connector Symbol: Connects separate parts of a flowchart and indicates the continuation of flow from a different location.
- Summoning Junction Symbol: A point where multiple branches of a flowchart converge into a single process.
- Merge Symbol: Used where multiple processes or lists combine into one.
Additional Useful Flowchart Symbols
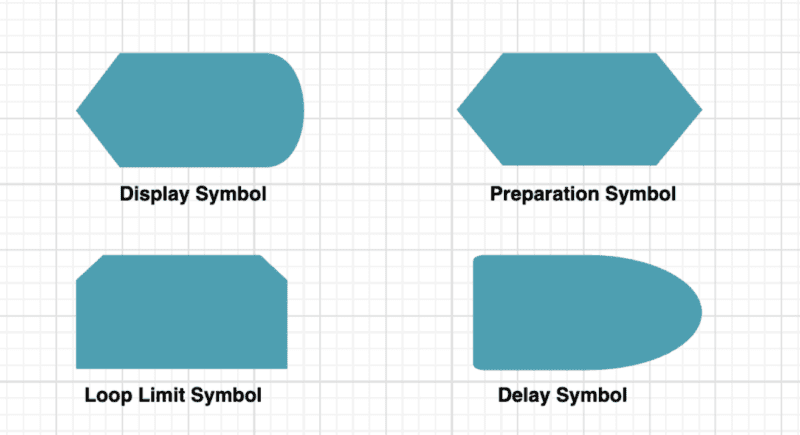
- Preparation Symbol: Prepares or sets up for a subsequent step in the process.
- Loop Limit Symbol: Defines the end point of a loop.
- Delay Symbol: Represents a pause or delay in the process.
- Display Symbol: Indicates where information is visually presented to the user.
What is the rule of the Flow Diagram?
Flowcharts are powerful visual tools used to depict processes, systems, or computer algorithms. They are governed by specific rules that ensure clarity, readability, and universal understanding. Here are some fundamental rules to follow when creating a flowchart:
- Start and End Points: Every flowchart must have a clear starting point and an ending point. Ovals or rounded rectangles typically represent these and help define the process’s boundaries.
- Sequential Flow: The flow of steps should be from top to bottom or left to right. This linear progression makes the flowchart easier to follow and understand.
- Use of Standard Symbols: Stick to standard flowchart symbols (ovals for start/end, rectangles for operations, diamonds for decisions, etc.). This ensures that anyone reading your flowchart can easily understand the actions and decisions being represented.
- Decision Points: Denote decision points, which typically require a yes/no or true/false input, with diamonds. Ensure that each decision point leads to at least two paths, clearly labeled to show the direction of flow based on the decision made.
- Connector Symbols: Use connector symbols (circles or small labels) if the flowchart spans more than one page or is too large to fit on a single page without losing clarity. These connectors indicate that the flow continues elsewhere.
Conclude
Flowcharts are an excellent tool for mapping out complex processes in a visually digestible format. Understanding the standard symbols can greatly enhance your ability to communicate effectively. Try out Mocky for Confluence to create the most intuitive Flow Diagrams.
Related Blogs:

