Jira stands out as a cornerstone tool, renowned for its adaptability and comprehensive features. Central to its effectiveness is the Jira diagram, which has become essential for modern project planning.
This article explores the transformative potential of Jira diagrams, focusing on how they optimize project planning and execution efficiency.
Understanding Jira diagrams
Jira diagrams are a suite of visual tools within the Jira software that serves to enhance project management through effective visualization. These diagrams are designed to cater to various aspects of project planning and execution, each offering unique perspectives and functionalities.
Types of Jira diagrams and their functions
There are various types of diagrams that you can use to take advantage of and enhance your productivity. Still, the most commonly used diagrams in Jira include Gantt charts, flowcharts, Kanban boards, and Burn-down charts.
1. Gantt Charts
These are essential for long-term project planning and tracking. Gantt charts in Jira provide a visual timeline of the project, outlining when tasks are scheduled to start and finish, their duration, and how they overlap or depend on each other.
They are particularly useful for understanding the overall project timeline and how individual tasks interlink within it.
2. Jira flowcharts
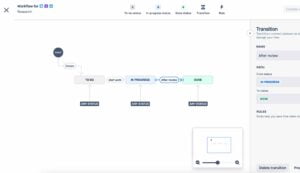
Flowcharts in Jira are used to map out and understand workflows or processes. They are instrumental in visualizing the sequence of steps in a project or a specific process within it.
Moreover, this visualization is crucial for identifying potential inefficiencies or bottlenecks in workflows and for ensuring that all necessary steps are accounted for.
3. Kanban boards
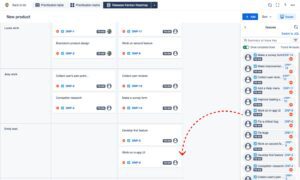
Designed for agile project management, Kanban boards provide a real-time view of the progress of tasks. They help in managing work in progress and are ideal for teams that need to adapt quickly to changing priorities. Kanban boards visually categorize tasks into columns, typically representing different stages of completion, from “To Do” to “Done.”
4. Burn-down charts
These are used primarily in Agile methodologies to track the amount of work remaining in a sprint or a project. Burn-down charts in Jira show how quickly the team is completing tasks against the planned work trajectory, helping to predict whether the project is on track to meet its deadlines.
Benefits of using a Jira diagram in project planning
Jira diagrams offer various advantages for project planning, significantly enhancing the efficiency and effectiveness of project management processes.
1. Enhanced visualization and clarity
Jira diagrams excel in simplifying complex project data, making intricate details and processes easily understandable through visual representation. This feature is particularly beneficial for projects that involve numerous tasks and milestones, where traditional textual or tabular formats might fail to convey the full picture.
For example, Gantt charts in Jira are instrumental in providing clear visual timelines, which are crucial for comprehending project schedules, understanding dependencies, and identifying critical paths. Moreover, these visual tools are invaluable for risk identification and management.
By mapping out the projects visually, potential risks and issues become more pronounced, enabling teams to take proactive measures and make informed decisions.
2. Improved collaboration and communication
One of the standout advantages of Jira diagrams is their ability to create a shared visual language, bridging communication gaps among team members. This common visual understanding is essential for ensuring that all team members, regardless of their roles or expertise, are aligned and working towards the same objectives.
For remote work and distributed teams, these diagrams are particularly vital for maintaining synchronized team efforts. They also play a significant role in stakeholder engagement, providing a clear and transparent means to present project plans and progress, thereby fostering trust and confidence.
3. Streamlining planning and decision-making
A Jira diagram contributes significantly to efficient resource allocation. It provides an overarching view of resource distribution and utilization, allowing project managers to make more strategic decisions regarding personnel and budget allocation.
The dynamic nature of these diagrams means that they can be rapidly updated to reflect changes or address unforeseen challenges, facilitating an agile response to project dynamics. Furthermore, the accumulation of historical project data in these diagrams offers invaluable insights for future planning.
By analyzing past projects, teams can identify patterns, anticipate potential hurdles, and refine their planning strategies for upcoming projects.
Integrating Jira diagrams into project planning
The integration of Jira diagrams into project planning involves a strategic approach that ensures these tools are effectively utilized to enhance the project management process. This integration is not just about using the tools but making them a seamless part of the project’s workflow.
1. The first steps for Jira diagram integration
The first step is to assess project requirements. Before integrating Jira diagrams, assess the specific needs and challenges of your project. You should determine which type of diagram (e.g., Gantt chart, Kanban board) best suits your project’s nature and scope.
Next is team training and familiarization. This will ensure that all team members are adequately trained and familiar with the features and functionalities of Jira diagrams. Nonetheless, this might involve setting up training sessions or workshops to help team members understand how to use these tools effectively.
Finally, you should customize your Jira setup to align with your project’s needs. This includes creating specific boards, setting up relevant workflows, and configuring diagrams to reflect your project timelines and milestones.
2. Integrating a Jira diagram into daily workflow
After finishing the initial steps, you can move on to integrate a Jira diagram into your daily workflow.
- Regular updating and maintenance: Keep Jira diagrams updated with the latest project developments. This includes adjusting timelines in Gantt charts, moving tasks in Kanban boards, and revising flowcharts as processes evolve.
- Use as a primary tool for reviews and meetings: Utilize Jira diagrams as the main reference point in project meetings and reviews. This encourages team members to interact with the diagrams regularly and ensures that everyone is aligned with the project’s progress and upcoming tasks.
- Feedback loop: Create a feedback loop where team members can suggest improvements or changes to the diagrams. This not only enhances the diagrams’ effectiveness but also fosters a sense of ownership among team members.
3. Best practices for effective Jira diagram integration
Now that you have known how to integrate Jira diagrams, it’s time for the best practices. By following these practices, you can ensure the effectiveness of each integration.

The first thing to remember is that consistency is key. In other words, you should ensure that the way data is entered and updated in Jira is consistent across the team. This consistency is crucial for maintaining the accuracy and reliability of the diagrams.
Next, you should remember to integrate with other tools. Where necessary, integrate Jira diagrams with other project management tools or software your team uses. Additionally, this integration can provide a more comprehensive view of the project and streamline workflows.
Last but not least, you should not forget to monitor and adapt. It means that you must regularly monitor the effectiveness of Jira diagrams in your project planning. Besides, you should also be ready to adapt and make changes to how these tools are used to ensure they continue to meet the evolving needs of the project.
Enhance Jira diagrams with Mocky
Mocky, a tool from the Atlassian Marketplace, significantly enriches the diagramming capabilities within Jira. Seamlessly integrated, it introduces advanced features for creating detailed and complex diagrams.
Its array of sophisticated shapes, connectors, and customizable layouts are ideal for projects that demand intricate visual representations. Besides, the app also supports multiple built-in templates, allowing effortless diagramming abilities.
In conclusion
A Jira diagram represents a pivotal shift in project management methodologies. Its adoption can lead to unparalleled improvements in project clarity, efficiency, and team collaboration.
Embracing these tools is not just an upgrade to existing systems; it is a step towards a more streamlined, intuitive, and effective project management future.